Inside the immense field of technical analysis lies the ability to understand and use technical indicators. These are mathematical calculations that track prices and offer an insight into the momentum of the market. They are not supposed to be predictive but remain very helpful in confirming any other type of analysis which is why they are always used as a secondary type of analysis.
One very famous indicator called the Relative Strength Indicator is known by every trader and analyst. The RSI has been created by J. Welles Wilder in 1978 as a momentum indicator. It seeks to find overbought and oversold zones, in a way that fundamental analysts seek to find overvalued and undervalued assets.
Another popular oscillator is the Stochastics which is similar to the RSI but incorporates the highs and lows of the recent period thus capturing some of the volatility. An issue with the Stochastics is that tends to be sticky at some levels which does not provide much information as to the current state of the market.
A third option is the Moving Average Convergence Divergence oscillator, also known as the MACD. This unbounded oscillator is followed by a many traders due to its simplicity and the fact that it is formed by exponential moving averages that take into account the recent weight of prices.
After over 30 years of research, we at BBSP have developed our own in-house proprietary methods of using technical indicators and are constantly improving our methods to find optimised results through constant and sophisticated back-testing and statistical significance tests.
In this brief article, we will focus on the RSI’s history and its usage.
RSI: How it works
The intuition behind the RSI is that it takes into consideration the different up and down days in order to compute their average to form what is known as a relative strength. We can think of this as a battle between buyers and sellers. If we take an example of a bullish trending market, we know that the buyers are in control, i.e. the volume of buying is greater than the volume of selling. What the RSI can tell us sometimes through its values, is the weakening of the buyers relative to the sellers, in other words, when the buyers are losing momentum. This is what we call a divergence and it is one way to use this indicator in trending markets.
Does this mean that the RSI can peak into market sentiment?
Yes and no ; yes because typically, when the sentiment changes, it is often accompanied by a weakening momentum of the prevailing trend,
and no, because it only uses price action and nothing else. It is truly impressive how a simple indicator can identify trend weakening.
In parallel, when dealing with ranging markets, the RSI is better used to locate oversold and overbought zones. These are levels that are considered extreme on average. Such an example would be the 30/70 combo.
The idea of an oversold/overbought level lies within the fact that when momentum reaches an extreme, it usually reverts back to the mean, in this case, the neutrality level of 50.
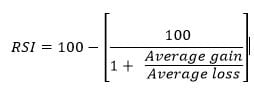
To come back to the RSI’s calculation, after calculating the relative strength, it should be normalised, for this we use a simple mathematical formula to transform it into the famous RSI that is bound between 0 and 100. The first step is to choose a look-back period which is by default 14 or 21, then compute a rolling measure of the average up periods and down periods. Dividing the average gains by the average losses, we get what is known as the relative strength. This is the key to the RSI formula; the rest is mainly normalisation.
How it is commonly used
Practitioners of most technical indicators and specifically the RSI like to standardise the oversold level at 30 and the overbought level at 70. This means that whenever the RSI reaches any of these two levels, the price action is deemed extreme and likely a correction can be expected. It is worth mentioning that this technique only works in ranging markets and on specific assets presenting mean-reversion characteristics. Experience is needed to properly detect and profit from divergence, applying it in the wrong conditions can easily lead to misleading signals.
Divergence typically means that when prices go one way, the RSI goes the opposite way signifying a weakening momentum and thus a possible correction or even a reversal. This technique is used mostly in trending markets to show that the trend may be weakening.
An additional technique, is the applying of charting techniques such as supports and resistances on the panel of the RSI giving it an extra discretionary layer. As it can be seen, from time to time, the RSI follows other supports or resistances than the usual 30/70 or 25/75 combo and this can create more opportunities when combined with more sophisticated methods.
Below is a simple chart with the RSI in the second panel. We can see that it follows prices but still remains bounded between 0 and 100 but generally remains within 30 and 70.
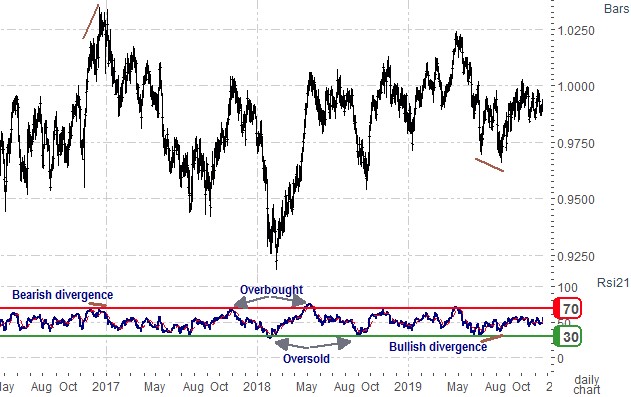
Figure. Simplistic representation of a security and its RSI.
Of course, no strategy is perfect and as with so many other methods, what works now may not work tomorrow. Fortunately, research on technical and fractal analyses is dynamic and always changing in order to stay up-to-date with the ever-varying market dynamics.
In conclusion, price action analysis embeds many techniques among them fractal and technical analysis, within which lie technical indicators. While extremely useful, they can be misused if applied on securities with incompatible characteristics or assets that follow too much of a random walk as opposed to a more deterministic property.
As is commonly believed, financial time series have a varying degree of signal-to-noise ratio and it requires a great deal of experience to try to extract as much signal there is possible in order to predict with a reasonable probability, the direction of price.
A key takeaway to all this, is that using the technical indicators should be part of a build-up process that requires first determining the state of the market and its strength, without neglecting to use Wave Theory to determine whether the right conditions are aligned and thus the indicators chance of working or not.