Correlation is at the heart of diversification which in turn is one of the pillars of modern portfolio theory. The most basic form of risk management is diversification and by this, we can infer that one should allocate assets based on weak correlations in the spirit of not putting all our eggs in one basket.
Correlation is one of the origins of ideas. With quality research, we can get many trade and investment ideas by using correlations so as to profit from market structure. However, as much as it is difficult to assume that historical correlation will continue to hold into the future, it is equally disappointing to know that during crises, correlations tend towards 1.00. This reality highlights the difficulty of understanding and managing them. At BBSP, over 30 years we have developed sufficient knowledge to allow us to profit from such imperfections in the relationships between different asset classes and different individual securities. We believe in a hybrid approach that uses first a bottom-up then a top-down approach to find opportunities. There is always a reason for a correlation break or emergence, and statistically, we capture it by using our advanced pattern recognition and machine learning algorithms.
Correlation is a statistical measure to calculate the linear relationship between two or more variables. There are many ways to calculate it among which some non-linear techniques. BBSP's pattern recognition systems use correlations to detect structural breaks and exploit them. We also use them in discretionary research for more fundamental ideas. For example, the Gold-USD relationship that has been shifty in recent months with a surprising positive correlation. We know that economically speaking, Gold should have a negative correlation with the US Dollar but recently, it is implied that the underlying fundamentals relating to this relationship have shifted and Gold has been more or less associated with low yields rather the US Dollar movement.
Correlation analysis allows us to understand how to manage the future for these two assets. It is well understood that it is a number between -1.0 and 1.0 with the former meaning a perfect negative correlation and the latter meaning a perfect positive correlation (i.e. the assets move together).
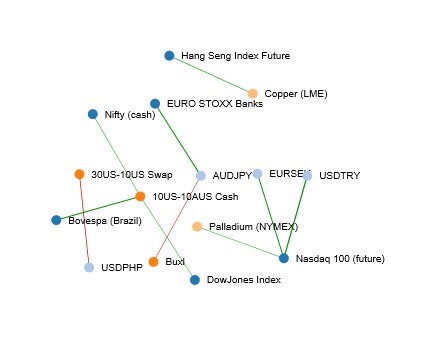
Figure: Example of one of our correlation trees.
What is this bottom-up top-down approach we are talking about?
Opportunity exists on both micro and macro levels and such, by analyzing the grand image (e.g. between asset classes and sectors), we can detect the big trends and relationships. With the bottom-up analysis, we are able to detect relationships between individual securities (e.g. McDonalds and Burger King). Amazingly, many statistically significant relationships arise from time to time that can also be explained fundamentally and this is where value is added; by finding structural breaks between assets, we can forecast assets’ directions that are supported by sound fundamental analysis.
Sanity check
At BBSP, we also use rolling correlations as well as instant correlations to see whether the linear strength is solid between the different asset classes or not. This allows us to calculate the probability of a correlation break. Our views always take into account the ever-changing correlations in order to maximize the efficiency of our asset allocation recommendations (e.g. overweighting commodities versus equities). However, correlation measures are tricky; they are cyclical and as much as they are helpful, we at BBSP, always keep in mind the ever-changing nature of the relationship between different assets. The below shows the famous EURUSD-USDCHF correlation throughout the years on a daily horizon. Unfortunately, correlation does not imply causation and more complex analysis is needed to understand the full picture. The chart below proves that markets work in cycles and what is correlated today may not be correlated tomorrow.
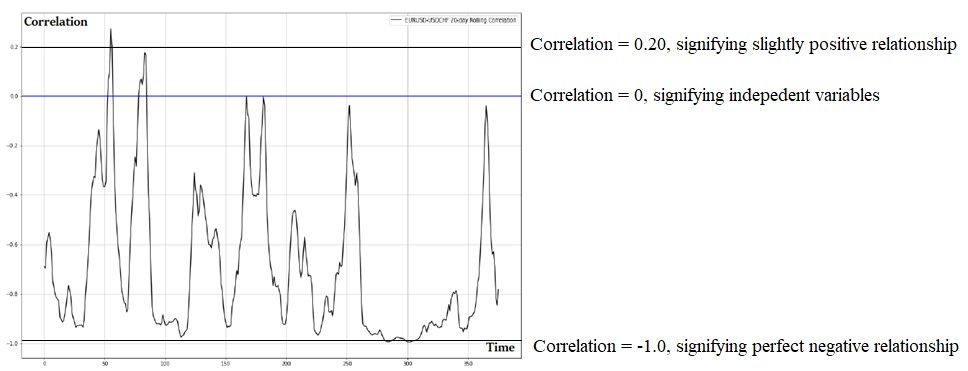
Figure: EURUSD-USDCHF rolling correlation.
It is not intuitive to have a long recommendation on EURUSD and on USDCHF at the same time but when we detect structural breaks and see an opportunity, we tend to exploit it. This is different from saying that the S&P500 will underperform the NASDAQ, because underperformance/outperformance does not imply negative correlation but simply a different magnitude of change. It is clear that correlation is not always stable, and one must always be careful. Detecting the breaks is not easy but rewarding when done right. Correlation is extremely helpful but remains backwards looking. We can always take measures to optimize it making it reflect the present more, but we must be very careful with its stability. We have developed tools over the years to make us comfortable in dealing with this factor. This is to say that correlation between markets looked independently can help us generate ideas. If we want to define what an idea is, we can simply state that it is a convergence of important elements on correlated markets that give us a higher degree of conviction.
We can also think of the idea as the result of joining the dots on different markets that are either intuitively correlated (e.g. different indices across the world) or unintuitively correlated (e.g. USDCNH and European rates).
The beauty of this technique is finding these unexpected relationships that pave the way for fruitful investment opportunities.