Volatility is a key concept in financial markets, it is the quantification of fear and greed. We use volatility in most of our models, from the traditional fundamental to the complex quantitative ones.
There are many types; Actual volatility is the measure of randomness at any particular time, used in option pricing models. Interestingly, actual volatility does not have a timescale as it is an instantaneous measure. Historical volatility is the most known measure, found through standard deviation. Its timescale is backward-looking which can sometimes be a disadvantage should volatility not repeat itself in the future. Implied volatility when inputted into the Black-Scholes formula gives us the current market price of options, hence its name. Its timescale is the option’s expiration which is why we can think of it as a forward-looking measure. Lastly, the forward volatility is simply a measure that can be used in a time period or instant in the future.
One key volatility time-series is the famous VIX index belonging to the family of the implied volatility category that has an undeniable negative correlation to US equity markets. It also seems to peak right around the bottom of the equity markets signifying the end of fear and the beginning of greed and thus opportunity! Options traders follow this indicator closely for pricing purposes.
how well can we predict volatility?
Do standard statistical tools serve as good predictors of the VIX?
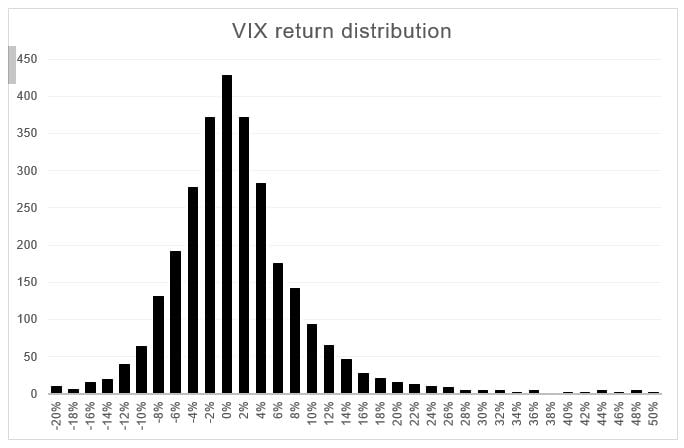
Normal distribution dictates that data should be symmetrical around the mean, which is the same as the median and the mode. Visually, it can look like a normal distribution, but so is the case for most of the financial time series. The first thing to notice in Figure1 below, is the fat right tail which seems to correspond to the number of spikes that the VIX makes.
Running standard statistical tests such as the Shapiro–Wilk test and D’Agostino’s K2 Test gave out results (0.872 and 1652 with p-values lower than the threshold of 5% respectively) which rejects the hypothesis of normality. Moreover, skewness, a measure of symmetry should be at zero with a normal distribution, when calculating this measure on the VIX returns, it gave out a whopping 2.25 indicating high skewness represented by the fat right tail. With these results, comes the power of behavioral finance and other tools to try to explain the movements of this powerful indicator.

Figure1: VIX return distribution shows a fat right tail.
We, at BBSP, believe that markets are dominated with emotions that impact decisions. Traders are influenced by many biases that impair their decisions and force the markets to diverge from any implied efficiency; conservatism, to confirmation bias, even the illusion of control, but a few examples which inevitably impact every market participant. This collective will, without a doubt, impair standard statistical tests and demand the emergence of a new type of analysis that focuses on empirical and actual data.
Focusing on a technical tool to help with predicting the VIX.
The VIX is a versatile indicator that can be used in many ways. It is never easy to predict its tops and bottoms especially given the rarity of these notable events.
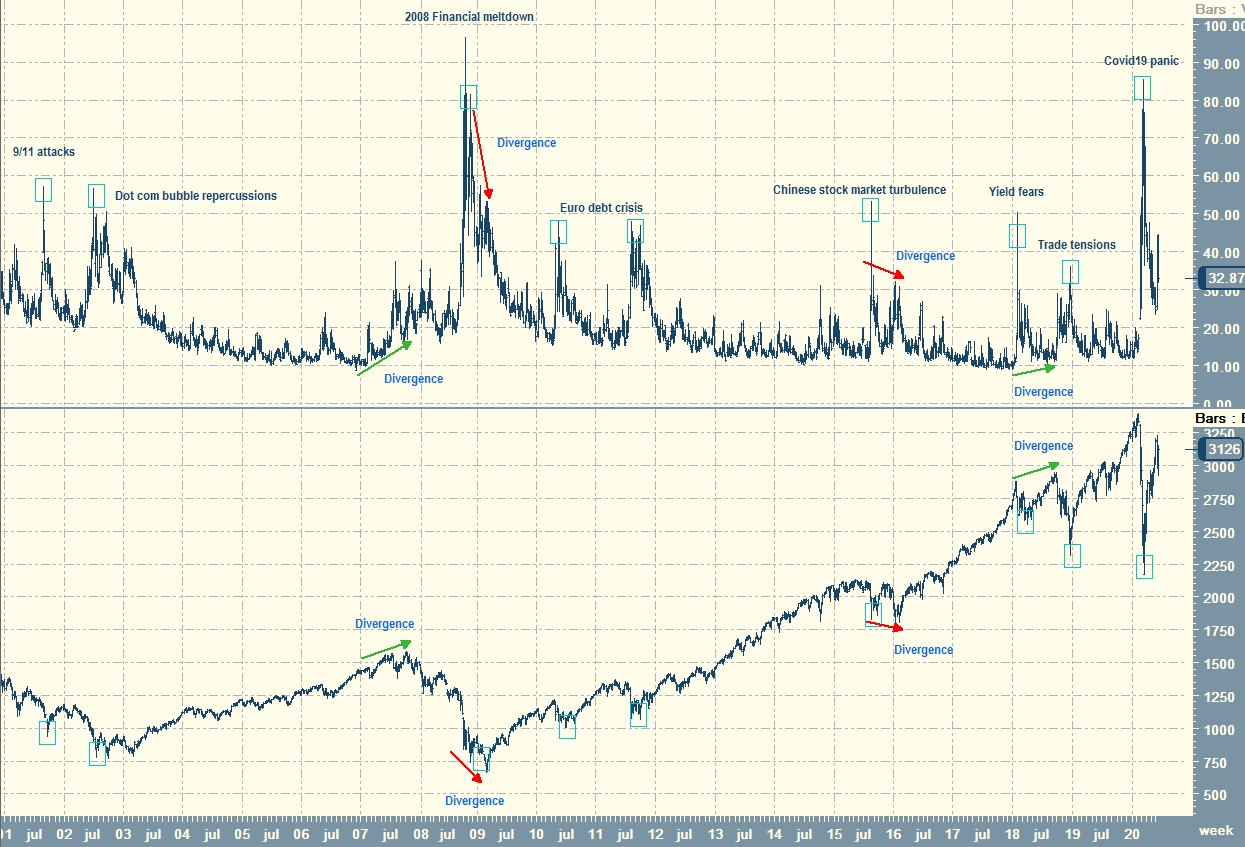
One way of using the VIX is through the concept of divergences. As many technical analysts know, a divergence occurs when prices make higher highs while a technical indicator such as the RSI makes lower highs, similarly, when prices make lower lows while the technical indicator makes higher lows. This can be seen as a sign of exhaustion of the current trend and consequently a potential correction or even reversal can be expected. The graph below shows a chart summarizing some of the world events that led to market peaks as well as some notable divergences that happened in the past. Here we highlight two important ones.

With the events leading up to the financial crisis, it would almost be easy to say that it was predictable in hindsight. From January 2007 until October 2007, the VIX started making higher highs while the S&P 500 also kept rising, the logic here is that we should have known that one of them was wrong. In this case, it was the equity market that failed to account for the risk coming from the toxic financial products offered by bankers that spread like wildfire throughout the world.... and we all know what happened next.
We also recorded one of the highest values in history on the VIX right around the time the stock market made its historical bottom, since then the market has risen around 380% alongside a gradual decline of the VIX. Speaking of this bottom, we can also notice that between November 2008 and February 2009, the VIX made lower highs while the S&P 500 also made lower lows, thus, presenting a bullish divergence that actually marked the bottom of the bear market.
Now, lets briefly take a look at the historical events that led to a spike in volatility and are examples of the randomness and complexity of predicting the VIX.
Amidst the tragic incident of 9/11, a sell-off has ensued bringing down the biggest stock market in the world over fears of an economic slump following the attack. The VIX briefly spiked representing the frenzy of the events, right before it started to gradually revert to its mean as it always does, this is a perfect example of a Black Swan event as described in Nassim Nicholas Taleb’s book, an event that cannot truly be predicted. With the dot com bubble already taking place since 2000, the market continued in its bear trend in 2002 coinciding with high values of the VIX. On the events of a European sovereign debt crisis stemming from the structural problem of the balance of payment. One of the most famous issues that fuelled this crisis was the big difference in contribution of several Eurozone members such as Germany and Greece. The issue arose when a European central bank with one interest rate was supposed to manage these two highly diverging economies. With the devaluation of Greece’s sovereign credit rating to junk status, the rest is history, markets are globally intertwined and react accordingly during crises. Next, China’s black Monday occurred with the Shanghai Composite losing 8.5% led to a spike in the VIX values, with a simultaneous drop in global equities. This also proves that in times of crises, correlations tend towards 1.00.
On the 5th of February 2018, stocks fell off a cliff with the S&P 500 losing 8.5% due to a surge in interest rates following a US job report. Trade tensions with Canada and China did not help the market around 24th of September 2018, when markets began to tumble until seeing a VIX top on Christmas Eve corresponding to a bottom on the stock market, to start a very good year in 2019.
2020 brought in a whole different story with regards to volatility. It is undeniably one of the most turbulent years in modern times. The stock market is still down around 4.40% since January, which is actually a breath of fresh air considering the low of 33% reached in March. From political tensions with Iran to the global Covid19 pandemic, traders worldwide were shaken by the severe volatility in almost all markets. VIX values reached the zone of the 2008 financial meltdown before declining right around the same time the equity market started to recover.
All this is to say that volatility is not by any means easy to forecast and there will always be a heavy debate on the right way it should be estimated and looked at. The truth is that there is more than one way and no way works all the time.
But if there is one thing for certain is that the VIX remains one powerful indicator and should never be neglected.

