It is little surprise that the global markets are intertwined right now and correlations are all around us, whether they are from the same geographical location or not. The global pandemic has done a number on financial markets, from equities downfalls to severe currency volatility.
It's important to read the charts during these times as they perfectly translate investors’ emotions and expectations. Price action will always be a leading indicator and a gauge to market sentiment.
Let us take a look at the DXY on a Tactical horizon, as an example.
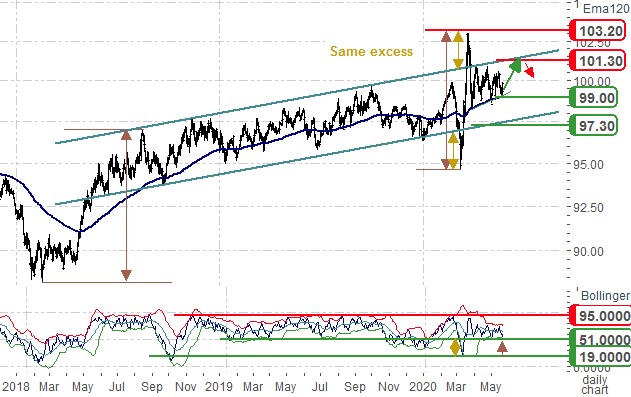
On this chart, we are highlighting the ascending channel started in June 2018. Notice how the DXY was well contained inside of it until an anomaly occurred with the Covid19 outbreak and major uncertainties mid-March that coincided with some panic. Symmetrically, the break of the channel on the downside around the March 5th is has the same amplitude as the surpass of on the upside around the March 18th. This phenomenon likely proves the resilience of this uptrend albeit the drastic fundamental fluctuations that occurred.
Currently, as we see that the bullish trend remains intact towards 101.30, we keep our levels that correspond with the channel as well as our directional. That being said, we do see a strengthening to at least 100.70 and 101.30 while holding above support at 99.00 confirmed by the 120-Day EMA and then we are expecting the move to reverse and the dynamic to change to a rather bearish DXY around 101.30.
So What does market sentiment say?
If we try to quantify the subjective and use an indicator that actually tracks what traders are saying, then we can use the Daily Sentiment Index to understand more the positioning. In the chart above, the second panel shows that the DSI is still positive and near support at 50% that coincides with bullish legs on the DXY. The latest break corresponds to the panics outlined above. A final technical element that can be seen on the DSI is the Bollinger bands which are standard deviation bands that envelop price and act as supports and resistances accordingly. In this case, the lower Bollinger band lies near the 50% support further advocating for its strength, at least until 101.30.
All in all, it seems that there are sufficient technical and sentiment elements to justify a push-up preference on the greenback towards the upper end of the ascending channel. However, with any analysis, comes its risks, and the risk here is the break of 99.00 which would directly take us to the lower part of the ascending channel at 97.30/96.00 the monthly level from where we expect that the support should hold.
BBSP.