Just as the barrel prices are experiencing a setback, our bullish conviction regarding oil markets may come as a surprise.
OIL; interesting correlations with copper, U.S. inflation
Adverse factors
Indeed, the beginnings of 2020 have seen some action on the oil price front. Throughout last year, markets had been kept in check by two main factors. The first was the low-key escalation of tension between Iran (world’s 5th largest oil producer) and the US — fueled by attacks on Saudi tankers last spring and summer.
Such possible bullish outlook was balanced, on the other hand, by growing uncertainties surrounding the world’s top oil importer, China — as operators tried to assess the adverse impacts of a looming economic slowdown in the Mainland, all the while contemplating the concretization of the long-awaited US-China trade deal.
In this cautious context, the killing of Iranian general Soleimani on January 3d, and the subsequent Iranian missile retaliation were enough to push the West Texas Intermediate (WTI) prices to a three-month high. More recently, short-lived concerns about Libyan oil supply disruptions have been eclipsed by the emergence of the Wuhan virus, and its possible impact on an already stressed Chinese economy.
Getting perspective
What sense can be made out of this muddled picture? Though no magic 8-ball, chart analysis may give us perspective on some resilient strategies carried by traders throughout the last weeks and months, despite the news’ ebb and flow.
A quick look at the Nymex Light Crude Oil chart evidences the nervousness of operators as of late. The spikes of January 3d (killing of Soleimani), and setbacks of January 8th (with Iran promising no further escalation of retaliatory strikes) and January 27th (on Wuhan concerns) are conspicuous.
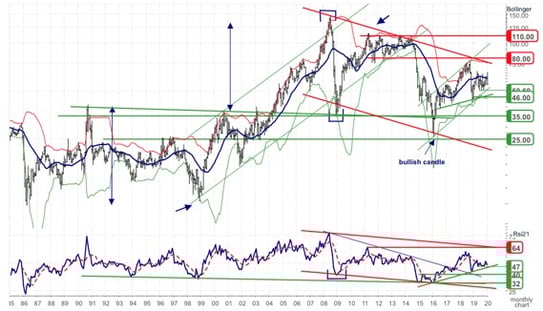
Yet on a mid-term horizon, a strong support around the $ 50.00 zone has remained unchallenged since January 2019 — each time a setback has reached that key level, a bounce occurred in the following sessions. A market consensus is apparent here: a majority of traders keep seeing the barrel as cheap for that price, which doesn’t fail to attract new buyers, or incite bears to close their positions.
So, the turmoil of day-to-day news flow shouldn’t mask a more general, bullish consensus. Long-term, the last major drop on LCO prices occurred in 2016. Since then, the barrel has been recovering, see-sawing between the ~ $ 50.00 support zone and the tops reached in 2018 — around $ 80.00 — a zone which hasn’t been touched since. Obviously, that’s the range most oil traders are comfortable with for now—and no fundamental news have come up so far dramatic enough to shake their confidence.
Now for the interesting point: we’re nearing the bottom of that range — which could either advocate for a trend reversal, or signal a profitable bullish opportunity for mid/long-term traders.
Taking cues from correlations
We root for the latter option, as a convergence of graphical and mathematical signals, in addition to our pattern recognitions tools, make a strong case for a bounce.
We feel it would take a dramatic change of events to push oil traders under that $ 50.00/barrel key level, and obviously the conditions are not met for now. The most probable scenario should see the barrel returning to its former tops of 2018, in the $80.00 zone.
Our confidence is strengthened by evidence of correlations with other significant assets. The study of correlations is a staple of our analytic process at BBSP. Though this paper choses to delve into some fundamental considerations, these never impact our systems and analysis methods in a direct way—we focus upon price history. But we’re much interested when two or more independent studies of assets that could be correlated to each other — at a macroeconomic or fundamental level — deliver similar signals.
Considering price history as a reflect of market consensus, seems logical, as financial markets become ever more connected and risk-adverse operators seek diversification in all asset classes, to observe such similarities. For example, in the wake of the 2008 subprime crisis, we detected concurrent bullish signals in nearly all commodities. At the time, key players were reallocating huge capital on the bet that emerging markets — prominently China — would compensate for the slowdown in Western economies. That bet would fuel the commodities bubble for nearly a decade.
In such instances, price correlations reflect more than mere mechanical variations of capital flow: they also hint at market intelligence — global, long-term, multi-assets strategies prevailing among some knowledgeable actors. They deserve attention.
Room for recovery
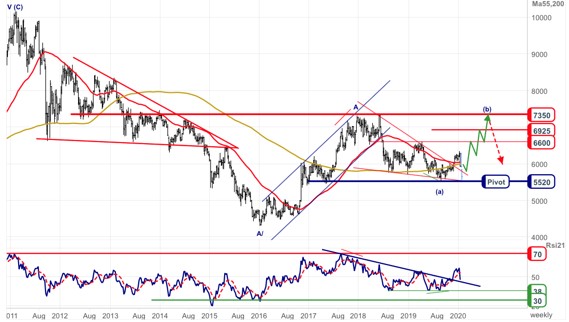
Case in point: the prices of copper, one of the most important base metals, the demand for which is obviously tied to industrial growth. As with oil, China is by far the top importer of copper, accounting alone for 25 % of all world demand — that’s nearly four times the volume of U.S. demand, and more than 1,5 times the demand of all European countries combined. As it happens, our independent studies of copper prices also deliver clear bullish signals, which bear striking resemblances with our oil picture. Once again, we have a strong support line, multiple signals advocating for a bounce — which has actually started —, with a probable target set near the tops the metal price reached in the autumn of 2018 (~ $7,380.00/tonne), concurrently with crude oil.
We register other similar convergences of the same type: all suggest that most commodities traders haven’t given up on growth and demand, though their long-term expectations clearly have abated—we’re far from the exuberance of 2008. Nevertheless, it seems to us right now that there’s ample room for the commodities recovery which started last September to carry on.
We should add that we’re not dealing here with a specific Chinese bet. These bullish signals can be related, for example, to the prospects of U.S. inflation — where our studies hint once again at similar configurations.
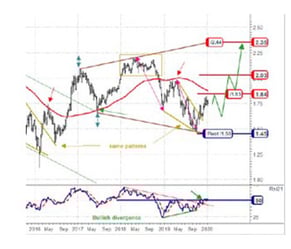 The chart on the left shows the U.S. 10-year breakeven rate, measuring the difference between 10-year Treasury bonds and Treasury Inflation-Protected securities. It is known as a reliable indicator of traders’ anticipation of inflation on a 10-year horizon—the rate climbs whenever higher or increasing inflation is expected.
Here we find, once again, some familiar features: a reliable support level reached this winter, with an upward bounce in progress, and no sign of reversal. This leaves room for a run to a mid-term upward target, once again the tops the breakeven rate reached in the second half of 2018.
Actions/Reactions
As our correlated analysis evidences, across various asset classes, a consistent scenario is shaping up. Despite short-term uncertainties, the market consensus seems now ready to bet on higher commodities prices and higher U.S. inflation throughout 2020, which implies a resurgence of world growth, driven at least by the U.S. and China.
In our view, a sentiment is gaining ground that the correction which ran from the end of 2018 to the end of 2019 has come to an end.
In due course, all market prices will eventually come to reflect some solid fundamental outlook: an accurate assessment of a company’s strengths and weaknesses, for example, or the global economic background. Yet they will take time to get there. Operators first have to work out and temper their repeated excesses—short-lived bouts of either, in exuberance or gloom.
This is why our major focus, at BBSP, is upon these action-reaction patterns which, simply put, are the way markets generally come to terms with the harsh, longer-term fundamental realities.
The oil setback of 2018, with its subsequent in-progress bounce, provide an excellent example of such a pattern. The dynamics here do not rely exclusively on figures: though striving for accuracy, they are first driven by collective hubris or fear, and the sting of errors past. As such, they become partly predictable—in terms of direction, target, or even risk management: and this is the know-how our clients expect and find so valuable in our research service.
BBSP Research.