We’d like to propose a focus on a Forex analysis we published some time ago. The currency pair in question is the EUR/HUF — the Euro to Hungarian Forint exchange rate, i.e. the price in forints for one euro. Hence any significant drop in that chart implies more buying power for the Forint and less for the Euro — suggesting the consensus expects a stronger Hungarian economy with respect to the Euro Zone.
Forex at BBSP
The EUR/HUF belongs to a basket of nearly forty assets—from developed and emerging countries—our Forex desk surveys on a regular basis, complemented by any discretionary Forex opportunities we may feel relevant.
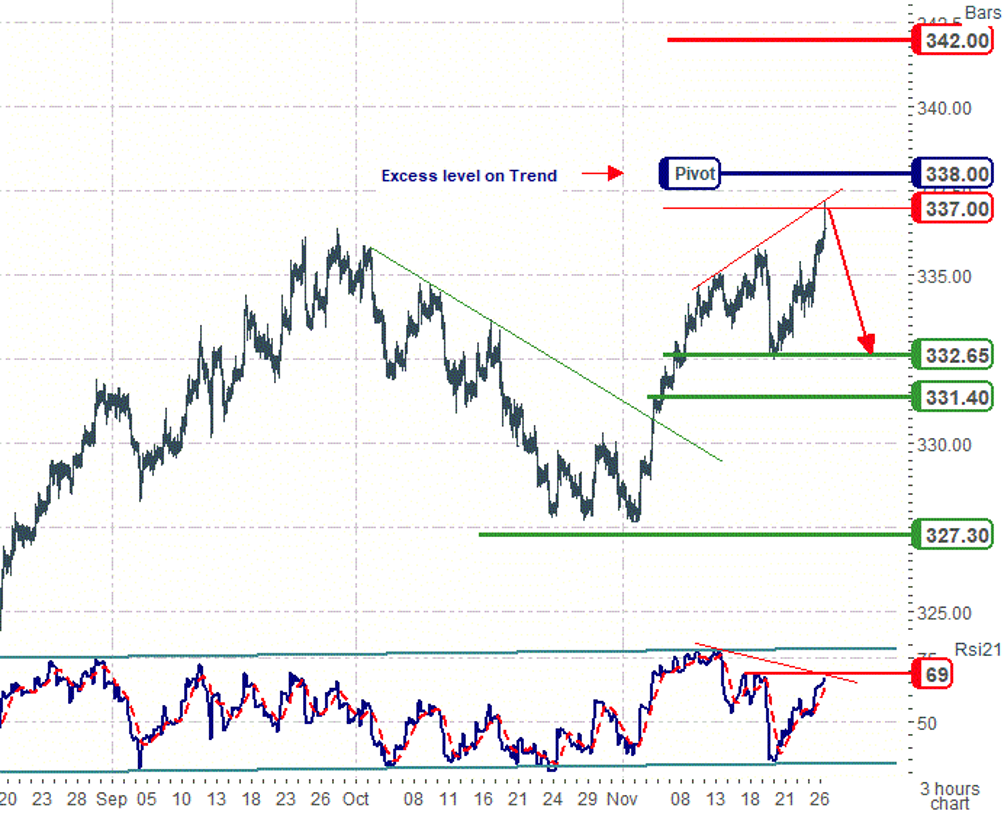
We issued this analysis on November 26th, 2019—as an update to our EUR/HUF scenario, on a weekly horizon. Here is the chart as published.
We set bottom targets at 332.65 and 331.40. The pivot blue line near the top signals a stop zone for the bearish scenario—in other terms, breaking up that key level might have fueled a bullish acceleration (stronger euro/weaker forint) disavowing our preference.
Though it highlights the core elements of an effective value play, the chart hardly vindicates the depth of research that led to those conclusions. Our analysts routinely ponder multiple signals and information sources, all focused on price history: price-pattern recognition, mathematical indicators, timing patterns, multiple horizons, and possible similarities with studies in other correlated assets.
Convergences
Any convergences of signals are good indicators of a scenario’s plausibility. In the above case, our analysts stressed the following points:
- Exhaustion signals advocating for a letting-off in the bullish run started in the first days of November,
- Such signals occurring near the targets of our long-term analysis (335-338), which attests a consistency between our weekly and trend views,
- Typical fractal patterns shaping up in the weekly graph, advocating for an imminent correction of the last bullish run,
- Sentiment indicators flashing a red light in that same area,
- A divergence registered on the Relative Strength Index (mathematical indicator), typical of an imminent correction or exhaustion,
- Some of our proprietary timing signals triggered, with a « sell » point locked at the top around 337.
The bearish targets were identified by convergence of levels in our various approaches. We tried to pinpoint significant support zones — key levels which, when reached, had previously triggered an upwards bounce, and were evidenced further by our studies of EUR/HUF on other time horizons. There is a psychological rationale behind such dynamics: those key levels represent zones of more active trading, thus more prone to trigger a change of heart in operators—either by initiating long, or closing short open positions. In other terms, they signal levels where the idea might prevail among operators that the asset is now « cheap », ready to be bought or bought back.
Context
By design, our analytical process ignores any fundamental or political elements—but it’s always interesting, once a study is completed, to look out for contextual information.
Hungary has been a member of the EU since 2004. An exports-oriented economy plagued by endemic government deficit, it experienced difficult years in the wake of the world subprime crisis (2008) — before the global bet on emerging markets, with its massive foreign investments, set it once again on the path of rapid recovery.
The major problem for the country is controlling its growth — which has registered a notable acceleration these last years, and is expected to slow down throughout 2020.
Our short-term study took place in that bearish background. The bullish run of November 2019 denotes a mounting defiance among operators, as the news of an incoming slowdown kept accumulating. By pushing up the EUR/HUF, the consensus was betting on some underperformance of Hungary — (and, possibly, on some weakness among Euro zone economies).
Now, the exhaustion signals registered might indicate that to a majority of traders, the abatement of Hungarian prospects had reached, or was reaching, its reasonable term. As it happens, a day after our update was published, actually, the Hungarian Statistical Office released unemployment figures consistent with this idea: the three-month rolling average jobless rate was at 3.5 percent in August-October 2019, unchanged from the previous three-month period, and down from 3.7 percent a year earlier. Though there were signs of tightening of the labour market, people laid off still had no great difficulty finding other jobs, which kept the unemployment figures in check. This did not infirm the general slowdown hypothesis, but it definitely nuanced the picture—and market operator were quick to catch.
How it played out
As can be seen in the below chart, the trade played out nicely, with a direct setback which reached our expected targets in the first week of December.
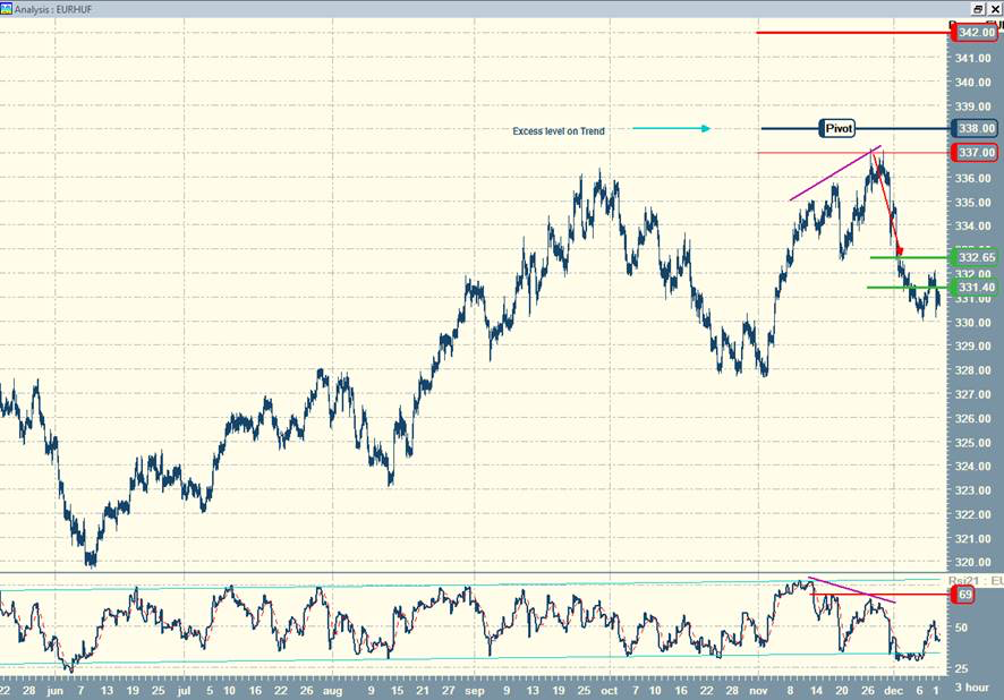
The 337 level, evidenced by our long-term study, did trigger a short-term reversal, just as expected.
You may also note that the push went past our second target by a slight margin — this is quite common —, but that the excess immediately called for short-lived bounce. This indeed shows that the zone remains a disputed level in the confrontation between buyers and sellers.
All in all, we have here a textbook case of accurate advice, and are most pleased with the way things turned out.
Interpretation
Does this mean that somehow, we could foresee the fortunes of Hungary’s economy in the chart? Even before the unemployment figures were released? No: what we could detect was an impending sentiment shift among currency operators.
Remember that we are dealing with a short-term study, whereas fundamental mechanisms work on the long term. The setback we anticipated was a 0.017% change, hardly significant for the Hungarian economy. Yet it did express an inflection in traders’ sentiment.
Markets are all about pricing; pricing means the collective assessment of some situation on the basis of available information. Obviously, there are keener or better-informed assessments than others (we can suppose the unemployment data were hardly a surprise for Hungary-based operators). The market arbitrates between everyone’s efforts to figure out an accurate EUR/HUF rate: the quotations see-saw as everyone revises their own assessment.
The setback we played is the expression of such a minor revision, triggered by the not-so-bad unemployment figures released to everyone. That was enough to turn an already fleeting sentiment, and establish a short-term bearish consensus. The exhaustion signals we registered did not really predict incoming good news for Hungary. They simply reflected the fact that less and less traders believed in the continuation of a bullish run.
Markets are constantly striving for accuracy; yet they work on excesses and corrections in their pursuit of fundamental realities, just like a needle indicator oscillates around some registered level. And that mechanism is of peculiar interest to us, as it relies upon internal factors—the group dynamics of buyers/sellers confrontation. In other terms, though reality always dictates the general picture, more often than not, the action-reaction pattern guides the details.
That’s when market action becomes partly predictable: our job is to detect such episodes, and convert them into value plays.
BBSP Research.