A time when only economists could be awarded Nobel Prizes in Economic Sciences has been over for decades. Mathematicians and psychologists have made major contributions to economics and financial markets and as true believers at BBSP, we are thankful to them for finally closing the long-dated, sterile debate between randomness and determinism in the financial markets field, or for at least taking it to another dimension.
Markets are fractal in nature
Financial markets reflect human behaviour, and to a large extent human behaviour can be modelled using algorithms that reproduce what is commonly found in nature. Mean reversion is the simplest example, fractals being the most evolved and accurate representation of financial markets.
But what is a fractal?
A fractal is a figure that is inside another figure and shares the same statistical properties as the former. It can also be stated that fractals are simply patterns within patterns which look alike. Consider the most basic example; a snow flake. We can notice its fractal elements with the similarity and auto-correlation between its different levels. Another famous example of a fractal figure is the Sierpiński equilateral triangle.
Also, it's worth mentioning that a fractal figure is not necessarily perfect but whereby a visible similarity can be detected.


How do we get to financial markets from this?
A financial time series has one of three characteristics: trending, mean-reverting, or simply a geometric Brownian motion.
A quick and easy way to know which of the three characteristics is valid at a given moment is through the Hurst exponent, developed by Harold Edwin Hurst while studying the optimum dam sizing for the Nile river in Egypt. Mathematically speaking, the Hurst exponent revolves around the idea of using the variance of a log price series to determine diffusion. Essentially, the function compares the diffusion of a time series to that of a geometric Brownian motion and identifies if the data possesses auto-correlation i.e. fractal properties.
Mandelbrot, a pioneer of the famous chaos theory that itself englobes the notions of fractality, auto-similarity, among other mathematical terms noticed that these properties could be applied to financial markets and specifically to stock market returns.
Thus, the Rescaled range was developed to test these properties. Access to the revised results of Mandelbrot's studies is hard, however, he did mention that he had better results than other measures, notably such as auto-correlations analysis.
The Rescaled Range in practice
It is worth-disclosing that we, at BBSP, add our proprietary touch to the formula when analyzing markets, and that what we are presenting below is the work of the highly regarded Mandelbrot.
The process entitles first selecting a look-back period, which in our results below will be the arbitrary value of 55, then to calculate the mean of this look-back period and its volatility using the statistical standard deviation.
After that, we measure the delta which is the current value minus the calculated mean of the look-back. Finally, we take the range which is the maximum minus the minimum of the look-back period and divide it by the current standard deviation.
The below results are not indicative of any trading strategy based on this formula, but show that with the right ingredients, it can be transformed into a robust model.
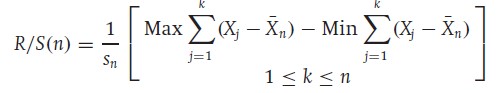
The white arrows pointing upwards signal a bearish exhaustion and a bullish direction may be expected, while the white arrows pointing downwards signal a bullish exhaustion and a bearish direction may be expected. The same goes for the blue arrows, only they are extremes, i.e. more statistical extreme levels than the white arrows.
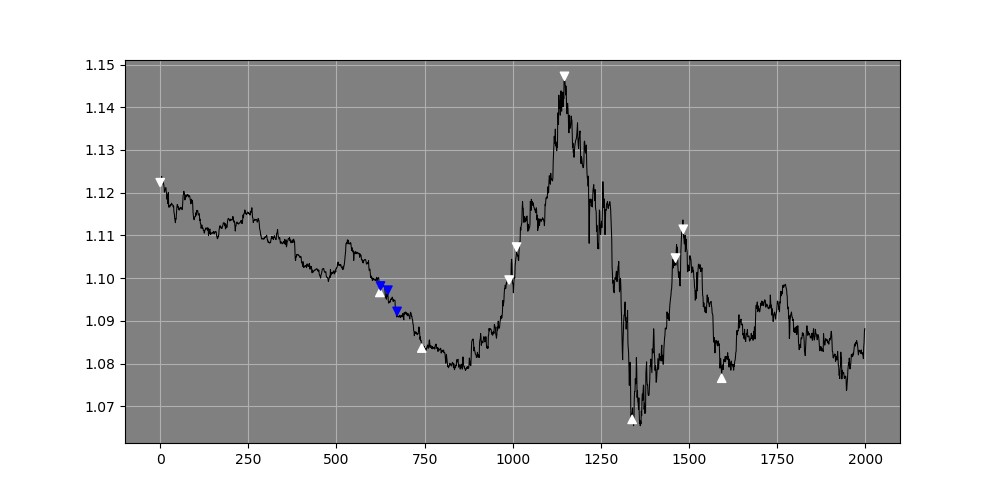
Figure 1 EURUSD hourly data with directional signals from the Rescaled range system.
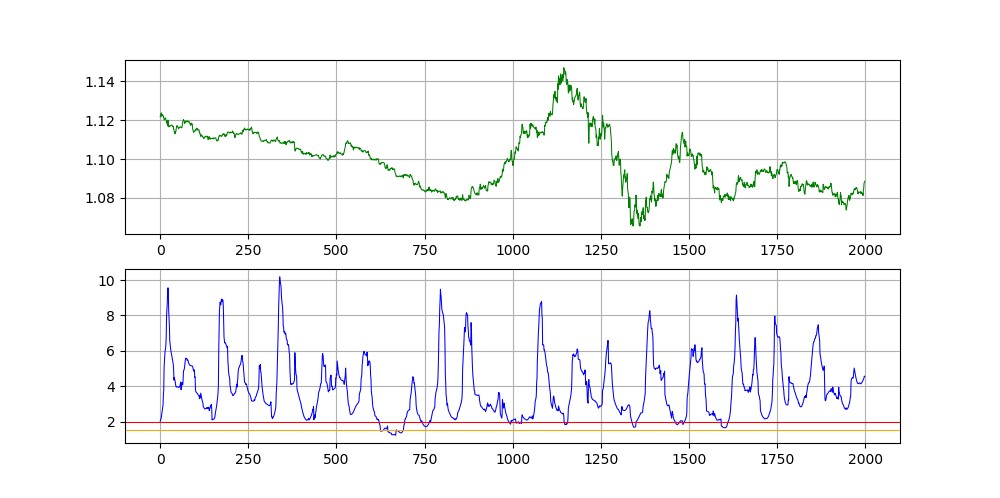
Figure 2 A chart detailing the EURUSD price chart in green (first panel) and the Rescaled Range analysis calculation in blue (second panel). The extreme values of the Rescaled Range lie around the zone of 2.00 which is where we expect the fractal relationship to switch and thus the direction of the price action to reverse course.
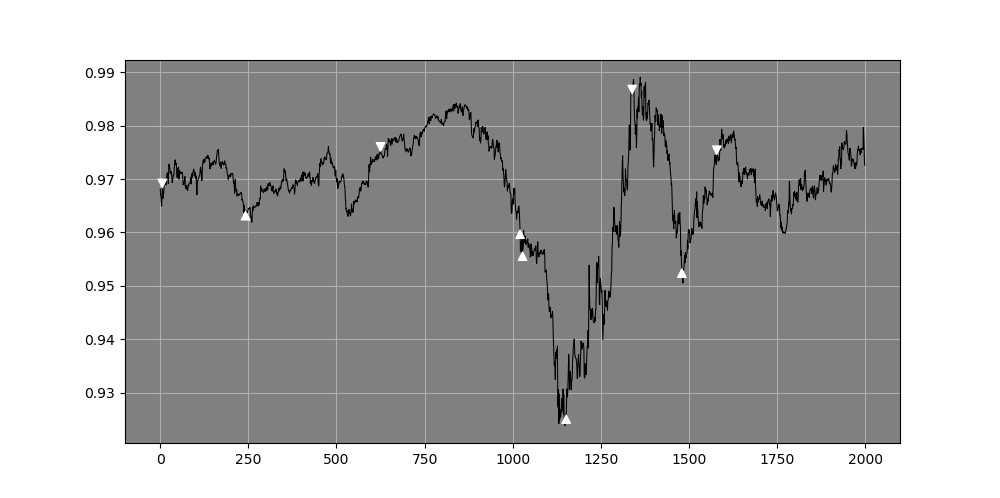
Figure 3 USDCHF hourly data with directional signals from the Rescaled range system.
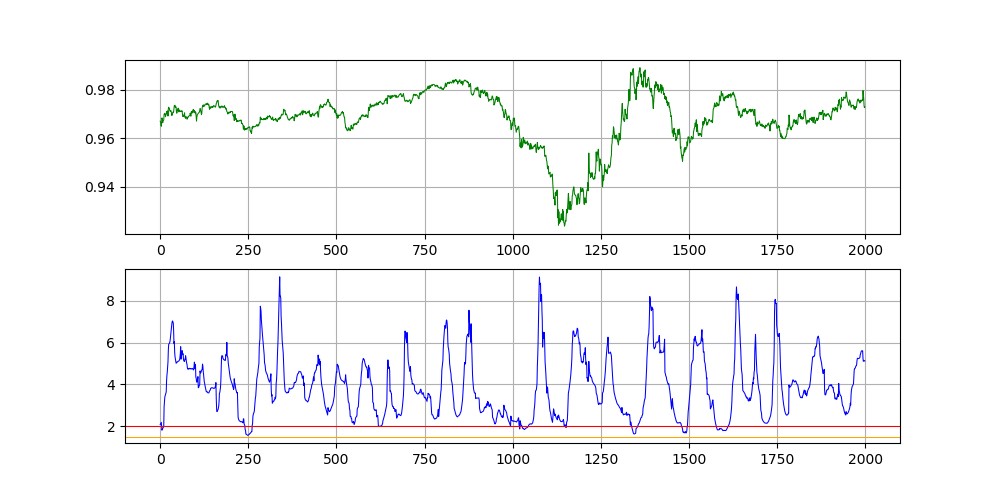
Figure 4 A chart detailing the USDCHF price chart in green (first panel) and the Rescaled Range analysis calculation in blue (second panel). The extreme values of the Rescaled Range lie around the zone of 2.00 which is where we expect the fractal relationship to switch and thus the direction of the price action to reverse course.
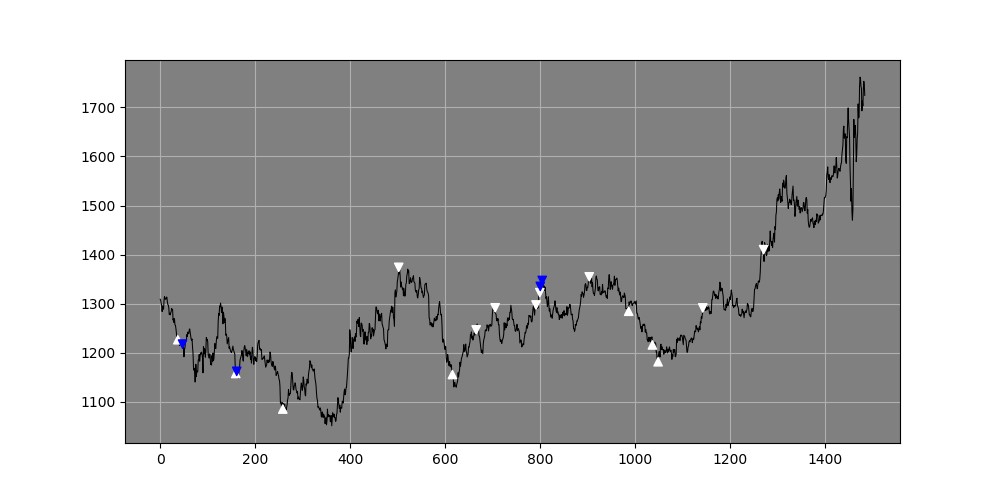
Figure 5 Gold daily data with the indicator working much better in ranging markets by getting the timing right.
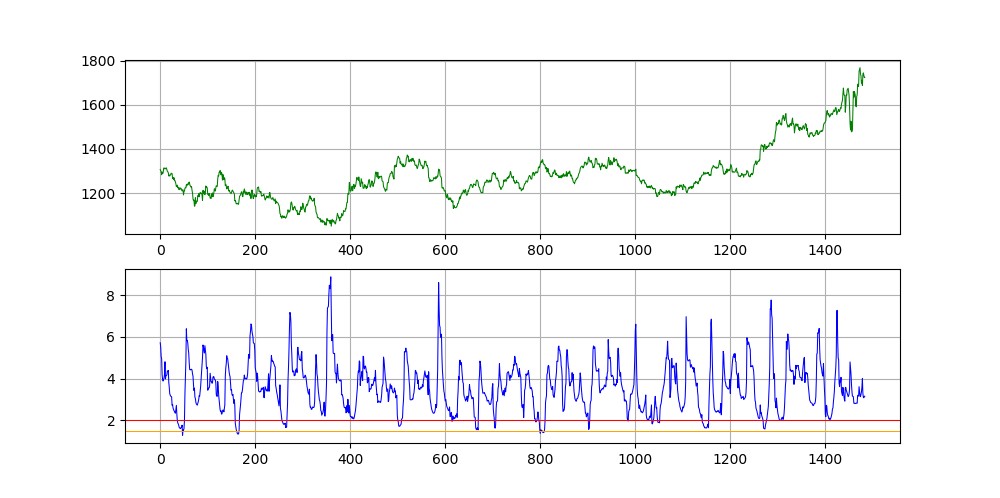
Figure 6 A chart detailing Gold (spot) price chart in green (first panel) and the Rescaled Range analysis calculation in blue (second panel). The extreme values of the Rescaled Range lie around the zone of 2.00 which is where we expect the fractal relationship to switch and thus the direction of the price action to reverse course.