We believe the breakout is for real. We base our conclusions upon BBSP’s proprietary approach, focused on comparative price action studies, as they reflect the group dynamics of investors worldwide. This helps us chart the capital flows in interconnected markets, and the building of confidence in global strategies.
What’s in a price
In due term, all market prices come to reflect reality, but takes time to get there. Operators first have to work out and temper their repeated excesses—short-lived bouts of either exuberance or gloom. Markets are constantly striving for equilibrium through the constant confrontation of buyers and sellers.
Hence we are attentive to action/reaction patterns that dictate the prices’ day-to-day see-saw, and to the rhythm and speed of such actions. As shown in this paper, comparisons of related assets are a staple of our approach: with most investors’ strategies now being played out on a global scale, correlation studies are an invaluable tool for assessing their bias and/or convictions.
A tale of two markets
If we look at the charts of S&P500 and the FTSE MIB. The former is, of course, the most-followed benchmark stock market of the U.S. economy. The latter for the Milan stock exchange (MIB), comprising the 40 most-traded stocks in Italy.
The FTSE MIB offers two characteristics of relevance. Firstly, due to the size of the Italian economy (third in the euro-zone), and as the interconnections of financial markets keep growing, its performances are closely correlated with those of other European markets such as DAX or CAC40—and, like them, with those of American equities.
At the same time, Italy maintains ties with Southern Europe, and just like Greece, saw its bond yields spike in the aftermath of the euro debt crisis. With a populist coalition now in the mix, voicing its opposition to EU governance, the country last autumn surpassed even Greece, becoming the riskiest borrower in Europe.
The takeaway is that the market consensus treats FTSE MIB as a Europe-focused, riskier, equities bet. With that in mind, it is interesting to compare the rhythms of recovery in the two charts, where the above-described dynamics of confidence building are clearly evidenced.
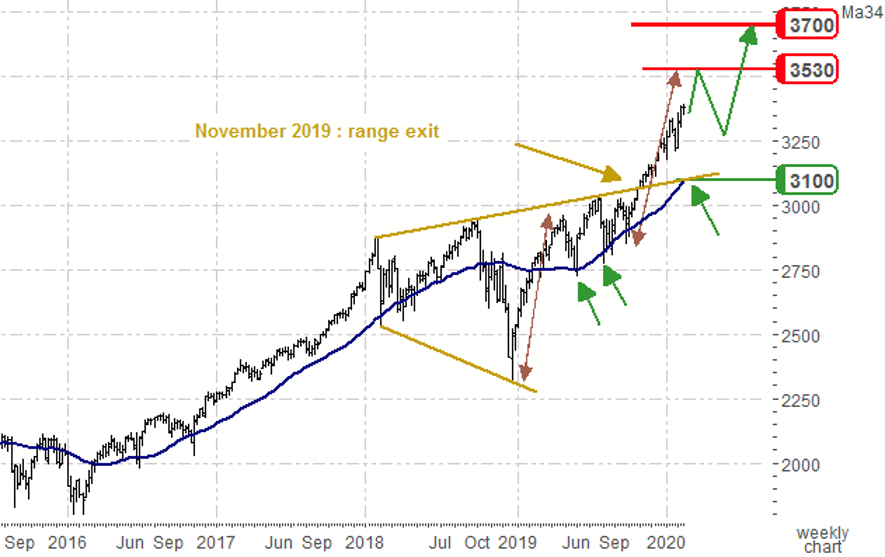
S&P 500.
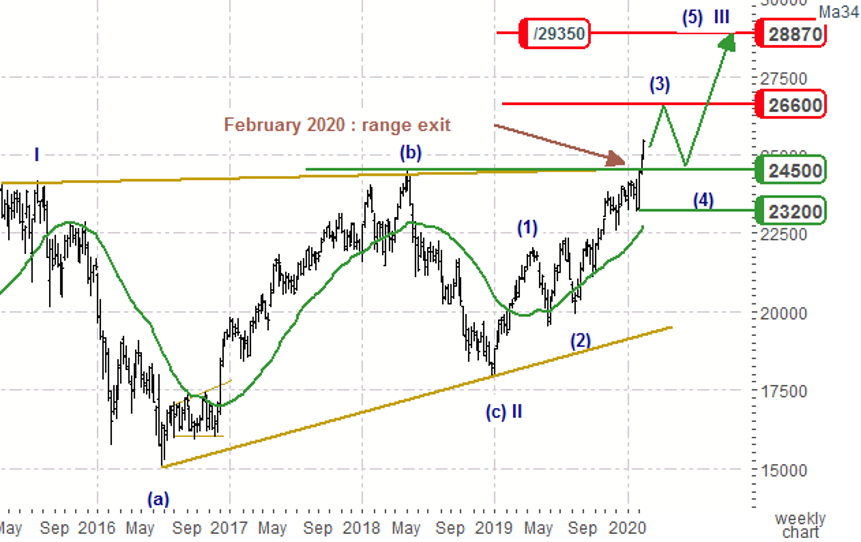
FTSE MIB.
One can see how price action seems to follow a loose, similar pattern in both indices, albeit with higher volatility, and a slight lag, in the latter.
More conspicuous are the relative speeds of the moves, with the S&P strongly out-performing the FTSE MIB. Although the direction was the same, investor confidence was still lacking for the Italian market.
In November 2019, the S&P 500 triggered a breakout of its former range, surpassing its 18-month tops. Breaking such key levels generally implies a straight acceleration — as happened here —, simply explained by group dynamics. A top signals some hotly-traded former point of equilibrium in the buyers-sellers confrontation: passing it disavows all former short bets, while enticing the longs to reach higher. The event reflects a change in the consensus around price, introducing operators to a new trading context, and new uncertainties. Due to the memory of past confrontations, as everyone reassesses their strategies, it will take some time for the shorts to regain confidence, and for the longs to lose faith.
BBSP detected the event at the time, and we set mid and long-term targets at 3530, then 3700. (N.B. our method ignores fundamentals to focus upon price history, seeking convergences of signals in various sources: pattern recognition, statistical and fractal analysis, correlation with other assets.)
While the S&P kept accelerating, the Italian index was still trading below its former tops of 2015 and 2018. It was only in February 2020, with a three-month lag, that the FTSE MIB triggered its own breakout, placing operators at last in a new trading context.
Takeaway
There are two lessons to take. First, we are bullish on the FTSE MIB, with targets, given by our comprehensive approach, at 26600, then 28870.
Shorts might not concede defeat easily on this riskier market, so intermediate consolidations can't be excluded, but the market’s upbeat mood is now apparent, and consolidations are generally subdued during such bullish bouts. Since group dynamics explain that any broken tops become effective supports, we do not expect the resistances at 3100 for the S&P, and 24500/23200 for the FTSE MIB, to be broken down this semester.
The second lesson, and the reason for this paper, is a case study in consensus change. The fact that investors' aversion to riskier Equity benchmarks has at last been removed, enticing them to seek performance even on Italian stocks, demonstrates a clear consensus towards a durable bullish trend.
BBSP Research.